You're already testing! 'Ad hoc' testing is the first type of testing every developer does, and it will likely become a permanent part of your workflow. Let's learn about some of the tools available to us that you can start using today (if you're not already).
Table of Contents

Principals of Ad Hoc Testing
'Ad hoc' is a latin phrase that signifies a solution to a problem that wasn't planned for.
We do ad hoc testing because we don't have a test plan in place. This could be because our team isn't organized, or it could be simply because we've encountered a novel problem (like when we're prototyping with a new language or tool).
As students, you're in the process of learning what problems to expect, so you're likely performing ad hoc testing all the time!
Today I'll share some of the tools that I use when working on prototypes, working with disorganized teams, or working on small personal projects.

Validators
Languages have specifications. Specifications are documented rules about how the languages work.
In English, we use words that aren't in the dictionary all the time, or we use them in new ways. That's great! If a lot of people find a new word or usage useful, it will eventually end up in the dictionary.
Language specifications evolve, too. You can write all kinds of HTML, CSS and JavaScript today that wasn't in the specification a few years ago.
Writing code meant for the browser is kind of like writing a family newsletter that will go to your grandparents and your cousins who speak English as their third language. If you use slang, some people may misunderstand, or lose the meaning entirely.
So how do we know if our code meets the language specifications? Do we have to read through all the W3C specifications Opens in a new window?
Heck no! We can just paste our code into a validator and get detailed feedback!
For all your validation needs:
Validators have the same limitations as a dictionary: they can check the building blocks for correctness, but they are limited in their ability to tell you if you put it together in a way that makes sense.

To go one step beyond validation, we need to use a linter.
Linters
You'll notice that in the validator list, we didn't see our third pillar of front-end development: JavaScript. That's because a JavaScript validator would only catch a fraction of common errors.
A software linter analyzes computer code and checks for validity, but also for common mistakes that are technically allowed, but rarely correct. Since JavaScript is a very "permissive" language, linters are very popular tools (same goes for Python).
For ad hoc testing, JSHint Opens in a new window is very popular. You can go to the website, paste your code in, and quickly see any errors, warnings or potential problems.
For incorporating into your build process, ESLint Opens in a new window is tremendously popular Opens in a new window, but we'll look at incorporating tools into our build process another day.
Print Debugging (Logging in the console)
...if I had had to lose the fairy tales in order to acquire the novelists, I would not say that I had grown but only that I had changed. A tree grows because it adds rings: a train doesn't grow by leaving one station behind and puffing on to the next. C.S. Lewis, On Three Ways of Writing for Children
Print debugging is the process of understanding how our own code is working by printing out values at different points in the process. It's probably the first type of debugging that most developers learn. It's one of those things that is so easy that some people might tell you to stop doing it because it's "immature".
You should definitely not stop at print debugging, but I doubt you will ever find yourself at a point where print debugging isn't sometimes the best tool for the job.
In web development, print debugging is usually done by outputting values to the console. Later we'll learn about how to do this through the terminal, but for now we'll be taking advantage of the built-in console that comes with all modern browsers.
The console API comes with a bunch of different methods Opens in a new window, including grouping, timestamps, and all other kinds of cool stuff.
Today we're just going to get familiar with a few that are pretty handy when doing ad hoc testing: log(), table(), count(), and assert().
console.log()
Hopefully you're familiar with console.log() at this point, but just in case...
log() outputs whatever you like from your code, and prints it in the browser console (accessible through your browser's developer tools).
/myScript.js
// Set the variable value
var myVariable = 'Hello World';
// Log the variable
console.log(myVariable);
// Change the variable value
myVariable += ', and Hello Anybody Else';
// Log the variable again
console.log(myVariable);> Hello World
> Hello World, and Hello Anybody Elseconsole.table()
.table() works the same way, but instead of just getting the output of a single value, we get more complex data, like arrays and objects, printed out in a nice readable table.
/myScript.js
var myArray = [
    "baseball",
    "horror movies",
    "strange guitar pedals"
];
console.table(myArray);(index) Value
0 "baseball"
1 "horror movies"
2 "strange guitar pedals"/myScript.js
var myObject = {
  name: "Simon",
  height: 183
}
console.table(myObject);(index) Value
name "Simon"
height 183console.count()

.count() does what it says on the box - it counts!
What does it count? The number of times it gets called.
/myScript.js
for (let step = 0; step < 5; step++) {
  console.count();
}> default: 1
> default: 2
> default: 3
> default: 4
> default: 5Want more than one counter going? Just pass in a name for your counter!
/myScript.js
var myLabel = "a label";
var myOtherLabel = "a different label";
for (let step = 0; step < 3; step++) {
  console.count(myLabel);
}
console.count(myOtherLabel);
console.count(myOtherLabel);
console.count(myLabel);> a label: 1
> a label: 2
> a label: 3
> a different label: 1
> a different label: 2
> a label: 4console.assert()
.assert() is a little different than the above. Sometimes it doesn't output anything!
The first parameter of the assert function is, go figure, an assertion. An assertion is anything that can evaluate to true or false.
A few assertion examples:
1 === 1 // true1 !== 2 // true1 === 2 // false12 % 3 <= 0 // true2 + 2 > 3 + 1 // falsetypeof 'Simon' === "string" // true.assert() also takes an error message as a parameter. If the assertion is false, it returns the error message. If the assertion is true, nothing gets logged to the console.
// This logs nothing to the console
var myNumber = 67;
console.assert(myNumber === 67, "Nope, it ain't!");var myNumber = 67;
console.assert(myNumber === 67, "Nope, it ain't!");
console.assert(
myNumber === 65,
"Okay, it was the first time, but not this time!"
);> Assertion failed: Okay, it was the first time,
but not this time!- The unreasonable effectiveness of print debugging Opens in a new window, Geoffrey Litt
- Console Opens in a new window, MDN Web Docs

Device Emulation
Well, hopefully someone's showed you this already - in your dev tools, you've got a very handy device emulator. The screenshots below are from Chrome, but other browsers have similar options.
Edge is nearly identical to Chrome.
In Firefox, the icon is on the right-hand side of the devtools instead of the left.
In Safari, press ^ + ⌘ + r, or from the "Develop" menu, select "Enter Responsive Design Mode".


Gesture support is limited - you can mock a "pinch-to-zoom" gesture by holding down the shift key - but for the most part gestures beyond swipe and tap aren't available.
In later weeks, we'll look at how to emulate devices in a more sophisticated way with device/environment/browser automation, but this is about the extent of what's available for ad hoc testing a web application.
- Simulate mobile devices with Device Mode Opens in a new window, Kayce Basques (Chrome Developers)

Manual Form Validation Testing
I'm going to go out on a limb and say that form validation is not something you should only be doing in ad hoc testing.
That being said, assuming you've got good requirements telling you what should or should not happen within your form, you'll often test forms in an ad hoc manner before passing it down the pipeline.
With that caveat stated, it's very important that you understand the difference between front-end validation and server-side validation.

Front-end vs server-side validation
This is front-end validation. Try entering some characters that don't match the pattern of a Canadian postal code.
Now inspect the form, delete the pattern, and try to submit the form.

Front-end validation is good user experience - it saves a round-trip to the server to tell the user that something's gone wrong with how they're inputting their input.
Front-end validation is not security. The front-end belongs to the user, and they are able to do whatever they want with it, because it is on their device. And that's a good thing - provided that you haven't mistaken front-end validation for a security measure.
So go ahead and confirm that your form meets the requirements that you're working with by, you know, using the form. I wish we had time to go through all the many delightful complexities of HTML forms, but just keep in mind - requirements don't just come from the client, so remember...
- front-end validation for usability, server-side validation for security,
- check accessibility by filling out and submitting the form using only the keyboard, and again using a screenreader
- the wonderful variety of names Opens in a new window people have
- you probably shouldn't regex emails Opens in a new window, and
- whitespace can be tricky.
- Client-side form validation Opens in a new window, MDN Web Docs
- HTML Inputs and Labels: A Love Story Opens in a new window, Amber Wilson
- Web Form Validation: Best Practices and Tutorials Opens in a new window*, Janko Jovanovic
(*older article, but still relevant)

Auditing Tools, DevTools, and other tools that require a local server
We're going to discuss a few tools below that require your page(s) to be "served" rather than simply sitting on your local machine. What's the difference between loading local files in a browser, rather than sending them from a server (local or otherwise)? Not a lot, but a little Opens in a new window.
Starting a local server
If you're using VS Code, there's a wildly popular extension called Live Server Opens in a new window that will take care of this for you.
If you'd rather take matters into your own hands, do the following:
To start a local server according to these instructions, you must have PHP (v5.4+) or Python installed on your system.
To verify that these are installed, open your command prompt (Windows) or terminal (Mac) and verify the version by running one of these commands:
php -vor
python -VBoth of these languages come installed on Macs. Windows users can install PHP by downloading PHP Opens in a new window, and Python by downloading Python Opens in a new window. Since we're in the second semester, though, hopefully one or both of these are already installed on your machine.
In your terminal, change directories into the public folder (or wherever your html files are) for your project.
Windows:
Set-Location -Path /path/to/publicMac:
cd /path/to/public
Start the web server with the following command for PHP:
php -S localhost:8000or for Python v2
python -m SimpleHTTPServeror for Python v3
python3 -m http.server
- After running any of the above commands, you can go to http://localhost:8000 Opens in a new window in a browser and see the index.html file served from the public server.
- How do you set up a local testing server? Opens in a new window, MDN Web Docs
- MAMP html source folder Opens in a new window, stackexchange.com (Note: if all of the previous section's instructions don't work out for you, you can try serving your plain HTML, CSS & JS files from your MAMP installation as described in this link.)
Lighthouse auditing
Lighthouse is Chrome's auditing tool. (There is a firefox Opens in a new window extension for it, but... just use it in Chrome if you can.)
It checks 100+ of metrics and best practices in five major categories:
- Performance: could your site be faster?
- Accessibility: are there any detectable accessibility errors?
- Best Practices: are there any mistakes with how you've configured and coded your page?
- SEO: are you doing everything you can to feed the web crawlers?
- Progressive Web App: are you doing what you need to do for your site to work as a PWA?

A handy tip - your browser plugins tend to inject a lot of stuff into the pages you're viewing. To get an accurate audit, load your pages in incognito/private browsing mode.
Each one of these audits not only gives you a score, but a detailed explanation of why you passed or failed, with a link to further reading if you need it.
You can select which of these audits you want to run - which is good, because 99 times out of a hundred, the site you're checking is probably not configured as a progressive web app.
The performance, best practices and SEO scores are all very handy. Not only are they a good way to check the health of your page, but, despite one category being called 'SEO', they are all good indicators of SEO - Google has stated that performance and best practices are factors in page rankings. Since this is Google's auditing tool, it's a safe bet that it's a good reflection of how they will look at your pages.
The accessibility score is worth looking at - anything flagged there is probably something that needs to be addressed. That being said, as discussed last week, accessibility is not something that can be entirely verified with an automated tool. Additionally, there is a tool I'd like to show you that does a considerably more thorough job of error checking and reporting.
- Lighthouse Opens in a new window, Chrome Developers
- Lighthouse performance scoring Opens in a new window, web.dev
aXe auditing
Deque Systems Opens in a new window is an accessibility consulting firm that has been around since 1999, and their auditing tools are first-in-class. In fact, Lighthouse's accessibility audit is a lightweight version of Deque's command-line tool, aXe-core. Later on in this course, we'll look at how it can be incorporated into our workflow.
For the time being, however, we're going to use aXe in our ad hoc testing on a per-page basis, because Deque are cool enough to provide a free browser extension for both Chrome Opens in a new window and Firefox Opens in a new window.
Simply add the extension to your browser, and you'll see it become available as a new tab in your dev tools!

Some other dev tools... tools
The dev tools in modern browsers are incredibly powerful. I wish we had time to go into everything here, but I'd just like to bring to your attention a few tools of particular importance to ad hoc testing that you may want to investigate further:
Storage
Want to see the cookies, localStorage and sessionStorage objects? Go to the 'Application' tab and check them out! I've added a few key/value pairs on this page - see if you can find them.
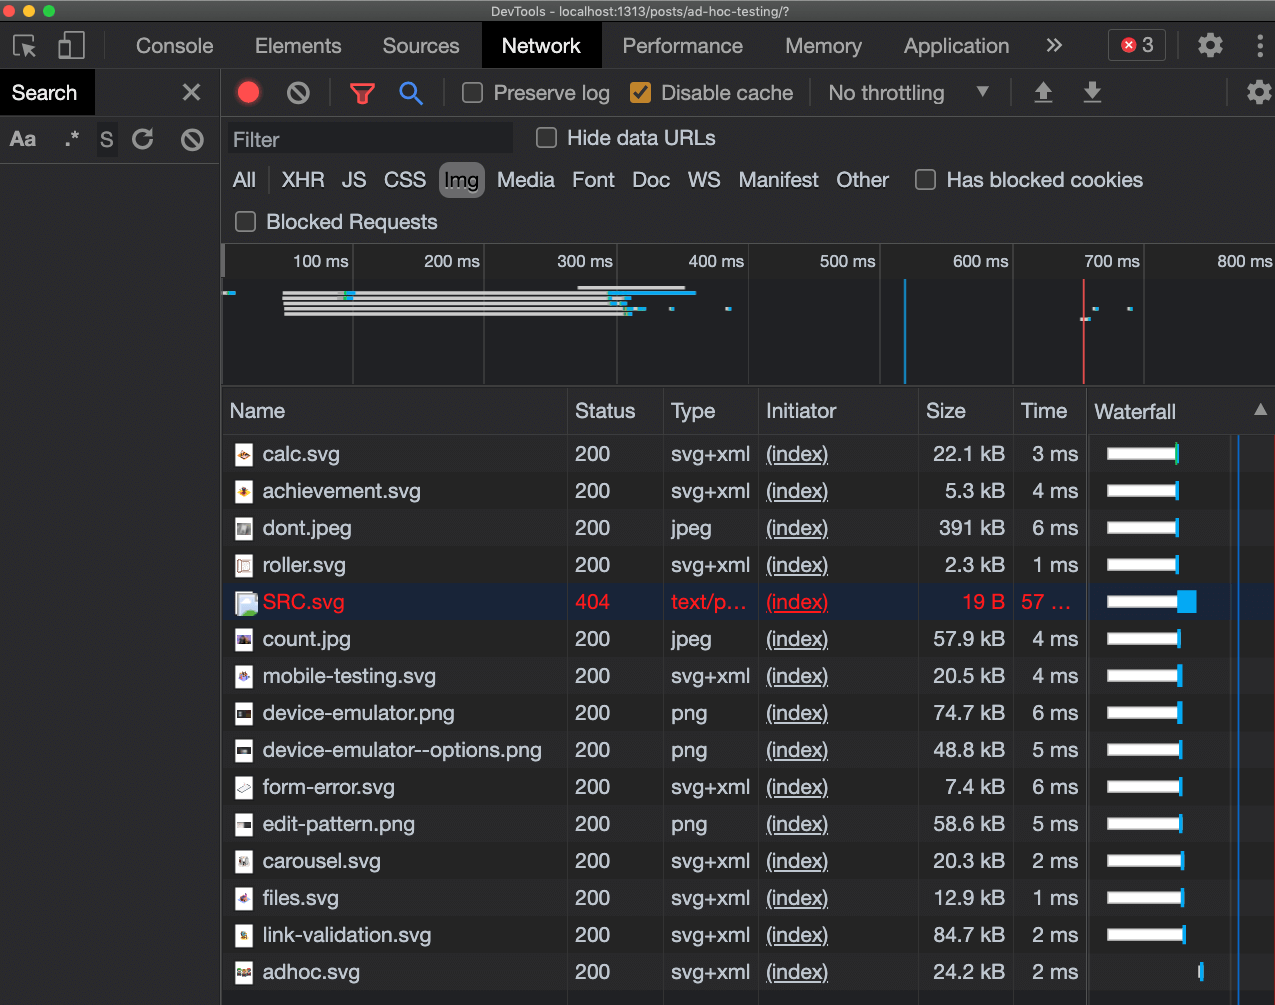
Assets
Want to see all the assets your page is loading, filtered by type, sorted by file size, flagging any assets not loaded?
Security
Want a quick security audit? Yup, there's a tab for that too! We'll spend some time with it later in this course.

Link Validation
One last handy tool enabled by serving pages from a local server: checking all the links on the page with the help of a handy Chrome Opens in a new window or Firefox Opens in a new window browser extension!
Just remember that what we're doing here is not checking that all the links are correct, only that they are not broken.
In summary
To sum up, ad hoc testing is quick-and-dirty testing for checking our work outside of a proper test plan.
- We can validate code
- (or lint for looser languages)
- print debug
- check device compatibility with emulators
- manually test forms
- audit pages
- troubleshoot with dev tools, and
- check link validity.